
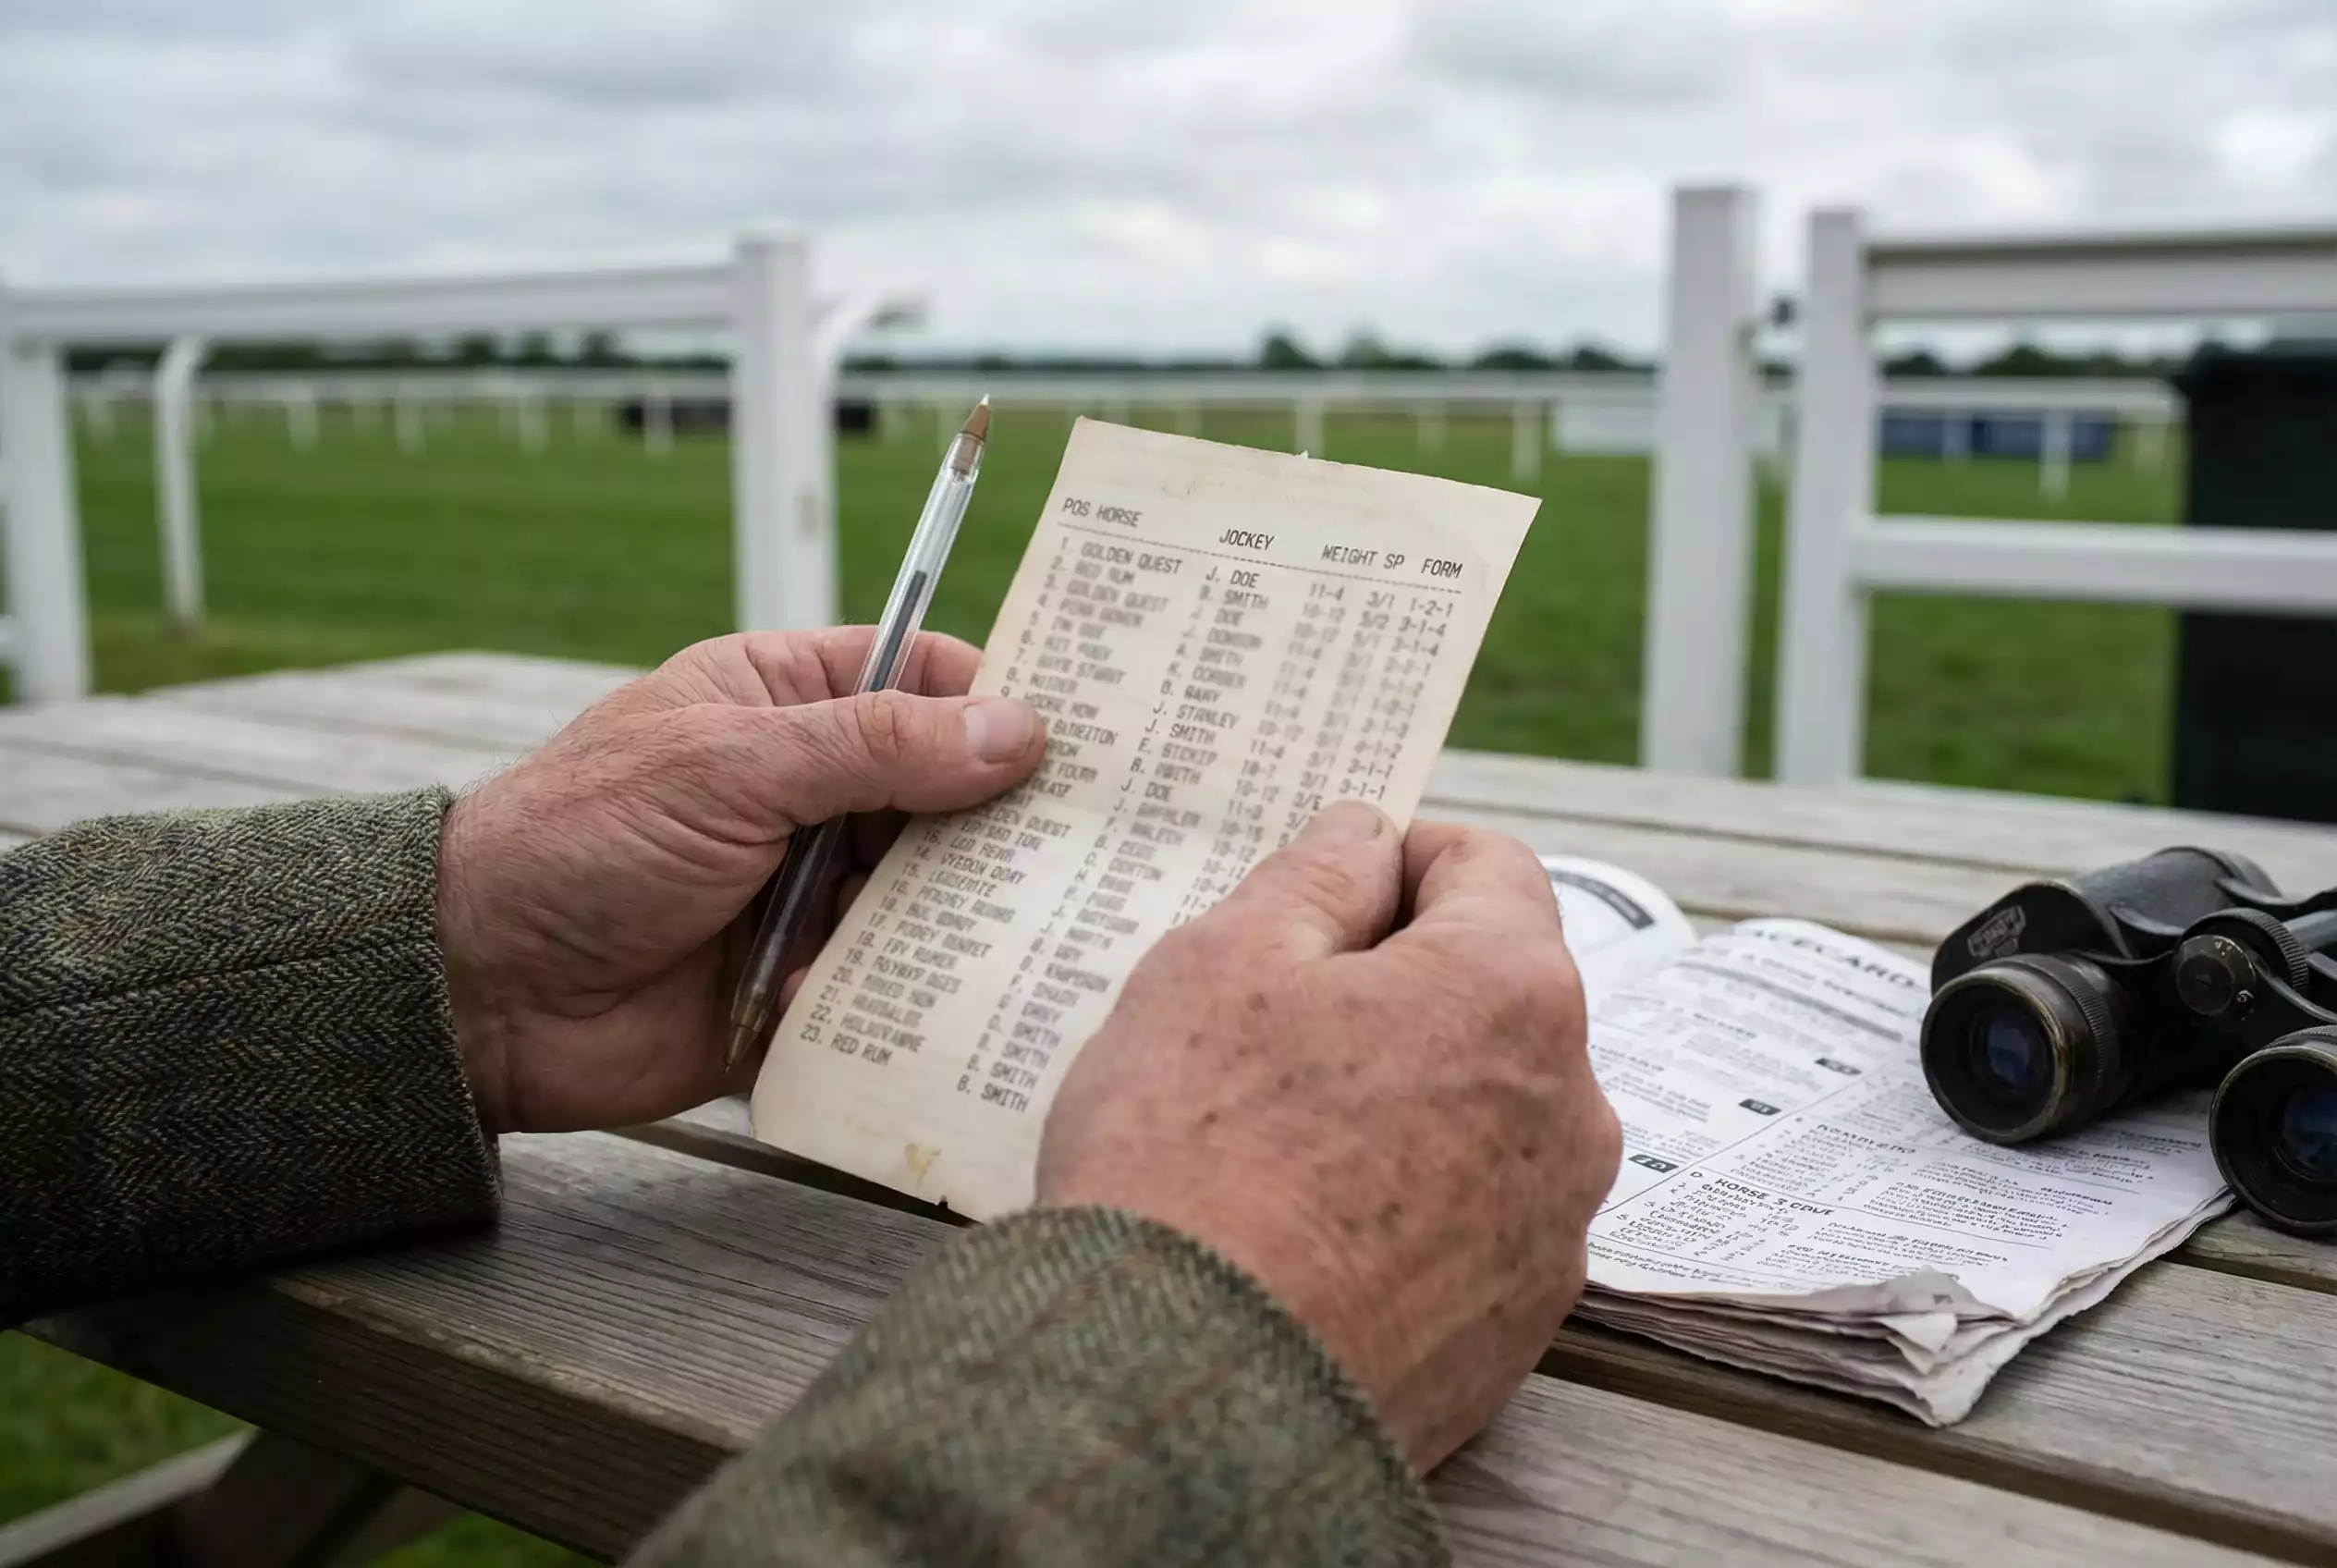
- A Southwell Result Card Tells You More Than You Think — If You Know What to Look For
- Anatomy of a Result: Every Column, Explained
- Starting Price (SP): What the Market Said About Each Runner
- Official Rating (OR): The Handicapper's Verdict in a Number
- Going: How Surface Conditions Change Everything
- Race Class: Why a Class 5 Winner Isn't the Same as a Class 2 Winner
- Form Figures and Shorthand: What 12806- Really Means
- Putting It Together: Reading a Full Southwell Result Step by Step
A Southwell Result Card Tells You More Than You Think — If You Know What to Look For
A horse racing result card is not designed for beginners. It is a compressed block of data — numbers, abbreviations, shorthand — that assumes you already know how to read it. If you do, it is one of the richest information sources in sport. If you do not, it might as well be written in code. This guide is for the second group.
We will use Southwell as the worked example throughout, because the course stages enough racing to generate results almost every week, and because its mix of all-weather Flat racing and National Hunt jumps provides a natural range of result types. But the principles apply to any British racecourse. Once you can read a Southwell result, you can read a result from Ascot, Cheltenham or anywhere else — the format is standardised across the sport.
What follows is a systematic walk-through of how to read horse racing results: every column, every abbreviation, every number that matters. The sections are ordered the way a result card is laid out, from the race header at the top to the form figures and finishing positions at the bottom. By the end, a line like “3-2116 (14) 9-2 OR 72” should read as clearly as an English sentence.
Anatomy of a Result: Every Column, Explained
A standard result card for a British horse race includes a header section and a per-runner section. The header tells you what the race was: the time it was run, the course, the race title, the distance, the class, the going, the prize money and the number of runners. A typical Southwell header might read something like: “2.30 Southwell — Class 5 Handicap, 1m (AW), Standard, 8 ran, £4,000 added.” Every element carries information.
The distance — 1m in this case — tells you one mile. Distances in British racing are expressed in miles and furlongs (a furlong is an eighth of a mile, approximately 201 metres). You will see notations like 5f (five furlongs), 7f (seven furlongs), 1m2f (one mile and two furlongs) and so on. At Southwell, distances range from 5f on the straight sprint course to around 3m on the National Hunt course. The “(AW)” suffix confirms this was run on the all-weather surface rather than turf.
Below the header comes the per-runner data, displayed in finishing order. The first-placed horse appears at the top; the last finisher at the bottom. Each line typically includes: the finishing position, the draw number (in brackets for Flat races), the horse’s name, its age, the weight carried, the jockey’s name, the trainer’s name, the starting price (SP), the official rating (OR) and, often, the horse’s recent form figures. Some results also show the distance between finishers — “1½l” means one and a half lengths, “nk” means a neck, “hd” means a head, “sh hd” means a short head.
The distances between finishers are one of the most underused pieces of information on the card. They tell you not just who won but by how much — and a horse beaten a neck in second has produced a fundamentally different performance from one beaten fifteen lengths in second. In slow-run tactical races, the distances can compress to almost nothing; in strongly run handicaps, they spread out and reveal the true gaps between the runners. Learning to read these distances as a measure of performance rather than just a margin is one of the first steps towards serious form analysis.
Finishing positions carry specific abbreviations for horses that did not complete the race: “PU” (pulled up — the jockey stopped riding, usually because the horse was tailing off or injured), “F” (fell — National Hunt only), “UR” (unseated rider), “BD” (brought down by a falling horse), “RR” (refused to race), “RO” (ran out — left the course), and “SU” (slipped up). These codes tell you something about the horse’s experience and temperament that goes beyond the bare result.
Starting Price (SP): What the Market Said About Each Runner
The starting price is the official price of each runner at the moment the race begins. It is determined by the on-course bookmakers and represents the collective opinion of the betting market — the thousands of individual decisions by punters, bookmakers and professional gamblers that coalesce into a single number for each horse. An SP of 3/1 means that the market thought this horse had roughly a one-in-four chance of winning; an SP of 20/1 means the market rated it a long shot, maybe a one-in-twenty chance.
Understanding SP requires grasping fractional odds, which is the format still used in British racing. The number on the left is what you stand to win; the number on the right is what you stake. At 3/1, a £1 bet returns £4 (£3 profit plus your £1 stake). At 7/2, a £2 bet returns £9 (£7 profit plus £2 stake). Evens (1/1) means you double your money. Odds-on prices like 4/5 mean you stake more than you win: a £5 bet at 4/5 returns £9 (£4 profit plus £5 stake).
Why does the SP matter when reading a result? Because it tells you what the market thought before the race, and comparing that to the outcome reveals where the market was right and where it was wrong. A horse that won at 14/1 either outperformed expectations or was underestimated by the market — and understanding which of those scenarios applies is the foundation of profitable form analysis. Over time, tracking which types of horse at Southwell consistently outperform or underperform their SP reveals structural inefficiencies in the market that can be exploited.
One practical note: the SP is not necessarily the best price that was available. Early-morning prices, exchange odds and individual bookmaker offers may all have been more generous than the SP that appears on the result card. But the SP is the standardised benchmark, and all level-stake profit calculations in racing use it as the reference point.
Official Rating (OR): The Handicapper’s Verdict in a Number
Every horse that has run enough races in Britain receives an Official Rating from the BHA handicapper. The rating is a number — typically between 0 and around 175 for the very best horses — that represents the handicapper’s assessment of the horse’s ability. The higher the number, the better the horse is judged to be. In handicap races, the OR determines how much weight the horse carries: higher-rated horses carry more weight, lower-rated ones carry less, with the aim of equalising the field and giving every runner a theoretical chance of winning.
At Southwell, the OR values you will encounter on most result cards range from the low 40s to the mid-80s. These are the bread-and-butter handicappers of the all-weather circuit — decent horses without being exceptional. The BHA reported that 2,052 individual Flat horses achieved a rating of 85 or above in 2024, an increase on the previous year. At Southwell, horses rated above 85 are relatively uncommon and tend to appear only in the better-class conditions races or Championship qualifiers.
The OR on a result card tells you where the horse sits in the hierarchy. A horse rated 55 running in a Class 6 handicap is in about the right place; the same horse running in a Class 3 is out of its depth. When you see a horse winning off a low OR in a lower-class race, it may be well-handicapped and on its way up. When you see a horse losing off a high OR in the same grade, it may be declining and about to be dropped by the handicapper. Reading the OR in context — against the class of race, the weight carried and the finishing position — is one of the most important skills in horse racing analysis.
The handicapper adjusts ratings after each race. A winner will typically see its rating raised by a few pounds; a well-beaten horse may see its rating lowered. This creates a constant cycle of reassessment that keeps the system dynamic. For form analysts, tracking OR movements between runs tells a story of whether a horse is improving, declining or being maintained at its current level — all of which feed into the prediction of its next performance.
Going: How Surface Conditions Change Everything
The “going” is the official description of the ground or surface condition at the time of racing. On turf courses, the scale runs from Hard (extremely firm, fast ground) through Good to Firm, Good, Good to Soft, Soft and Heavy (deep, holding ground that tests stamina). Each step on the scale changes the nature of the race: some horses love fast ground and hate soft; others thrive in the mud and struggle when the surface dries out.
At Southwell, the going system works differently depending on which course is being used. On the all-weather Tapeta surface, the going is typically described as “Standard” or occasionally “Standard to Slow.” The synthetic surface does not respond to weather in the same way that turf does, which is one of its core advantages. The Tapeta was refurbished in 2024 after flooding, and since the repair it has performed consistently within a narrow range. David Probert, a jockey with extensive all-weather experience, has noted how different the current surface is from its predecessor: “On the fibre, it paid to be aggressive and go forward from the outset, but the new tapeta surface is a lot fairer.” — David Probert, Jockey.
On the National Hunt turf course, the going changes with the weather and the season. Southwell’s jumps fixtures are concentrated in winter, so the going is usually on the soft side — Soft, Good to Soft, or occasionally Heavy after prolonged rain. The going description appears on every result card and is one of the most important pieces of context when assessing a horse’s performance. A horse that ran poorly on Heavy ground at Southwell should not be dismissed if its next run comes on Good ground at a different course — the conditions may have been entirely wrong for it.
When reading a result, always check the going before drawing conclusions. A horse that finished fifth on Heavy ground may have produced a better performance than one that won on Good ground, and the going is the variable that explains the difference. At Southwell, the consistency of the all-weather surface simplifies this — Standard is Standard, week after week — but on the turf course, the going description is essential context.
Race Class: Why a Class 5 Winner Isn’t the Same as a Class 2 Winner
Every race in British racing is assigned a class, from Class 1 at the top (Group races, Listed races) down to Class 7 at the bottom (low-grade handicaps). The class determines the quality of the field, the prize money and the range of Official Ratings eligible to compete. At Southwell, the all-weather programme runs predominantly in Classes 4, 5, 6 and 7, with occasional Class 3 events during Championship qualifying periods. The National Hunt programme sits in a similar band.
The class distinction matters because it defines the ceiling of competition. A horse winning a Class 6 handicap at Southwell is beating a field of runners rated roughly 0-60, often in a modestly competitive race. A horse winning a Class 3 at the same course is beating runners rated 0-90 or higher, in a meaningfully stronger contest. The two achievements are not comparable, and result cards that do not account for class are misleading. When the BHA introduced 170 Premier Racedays in 2024, it set minimum prize money thresholds of £20,000 per Flat race and £15,000 per Jump race, reinforcing the distinction between higher-quality and everyday racing.
For beginners, the easiest way to use race class is as a filter. If you are comparing two horses and one has won a Class 4 while the other has won a Class 6, the Class 4 winner has done something more impressive — it has beaten better opposition. That does not mean it will win when the two meet, because other factors (fitness, distance, going) intervene, but the class context sets the baseline. Reading the class on a result card is like reading the division in football: winning in the Championship is not the same as winning in League Two, even if the scoreline looks identical.
One subtlety: within each class, there are subdivisions — particularly in handicaps, where the OR band determines which horses are eligible. A Class 5 handicap with an OR range of 0-70 is a different proposition from a Class 5 with a 0-60 range. The result card does not always make this obvious, so checking the full race conditions (available on the BHA’s own website or through services like Racing Post) adds precision that the bare class number cannot provide.
Form Figures and Shorthand: What 12806- Really Means
The string of numbers that appears beside a horse’s name on a result card is its recent form, displayed in reverse chronological order with the most recent run on the right. Each digit represents a finishing position. So “12806-” means: the horse won last time out (1), finished second the time before (2), finished eighth before that (8), was unplaced below ninth (0), finished sixth, and the dash (-) indicates a break between racing seasons or a gap of more than a year.
Additional characters carry specific meanings. The letter “P” means the horse pulled up (did not finish). “F” means it fell. “U” means the jockey was unseated. “R” means it refused. “B” means it was brought down. A forward slash “/” separates this season’s form from the previous season, and a dash “-” indicates a longer break. The letter “C” or “D” after the form string — written as “C&D” — means the horse has won at this course and distance before, a valuable indicator of suitability.
Reading form figures is a skill that rewards practice. A horse showing “111” has won its last three races and is in excellent form — but it may also have been raised substantially by the handicapper, making it harder to win again. A horse showing “0060” has been well beaten in its recent starts but finished sixth last time, which might represent a small step forward. Context is everything: the same digits can mean very different things depending on the class of racing, the size of the fields and the margins by which the horse was beaten.
At Southwell specifically, the course-and-distance indicator (C&D) carries extra weight. The tight, left-handed configuration and the Tapeta surface create conditions that do not suit every horse, and a proven course-and-distance record is a more reliable positive indicator here than at a galloping track where the layout is less demanding. When you see C&D next to a horse’s name at Southwell, it means the horse has demonstrated that it handles both the surface and the geometry — and that proven record reduces one layer of uncertainty in your assessment.
Putting It Together: Reading a Full Southwell Result Step by Step
Let us walk through a hypothetical but realistic Southwell result card to tie everything together. The header reads: “6.30 Southwell — Class 6 Handicap, 1m (AW), Standard, 10 ran, £3,200 added.” You now know: this was a low-grade handicap (Class 6), run over a mile on the all-weather surface, on Standard going, with ten runners and a modest prize fund.
The winner’s line reads: “1 (3) Brightstar 4 9-2 J Hart R Carr 5/1 OR 58, form 321-41.” Breaking that down: the horse finished first, was drawn in stall 3, is named Brightstar, is four years old, carried 9 stone 2 pounds, was ridden by Jason Hart and trained by Ruth Carr. The starting price was 5/1, the Official Rating was 58, and the form figures show it finished third, second, first, then had a break, then won again, then finished first in this race. This horse is in form, has won recently, is handled by a regular Southwell trainer-jockey combination, and was reasonably fancied at 5/1.
The second horse reads: “2 (7) Distant Echo 5 9-5 C Hardie M Appleby 3/1f OR 61, form 42235-2, beaten ¾l.” This horse was favourite at 3/1, drawn wide in stall 7, carried more weight due to a higher OR of 61, and was beaten three-quarters of a length. Its form shows inconsistency — a mix of placings without a recent win — and it was ridden by Cameron Hardie, whose Southwell statistics carry a deeply negative LSP. The result raises a question: did the favourite underperform because of the jockey’s track record, or because the wide draw on the tight Southwell bends cost it ground? Both explanations are plausible, and the informed reader would consider both.
Further down the card, a horse that pulled up reads: “PU (1) Market Drift 6 8-10 B Garritty K Ryan 25/1 OR 48, form 00097-P.” The 25/1 price told you before the race that this horse had little chance, the form figures confirmed it (a string of poor finishes), and the pull-up is consistent with a horse that was out of its depth. The OR of 48 is at the bottom of the Class 6 range, and the trainer likely ran this horse for the experience or to keep it race-fit rather than with serious winning ambitions.
That is how to read horse racing results in practice. Each column contributes a piece of information, and the skill lies in assembling those pieces into a narrative that tells you not just what happened but why — and whether the result is likely to repeat next time. At Southwell, where the same horses, jockeys and trainers appear repeatedly across the season, the results form a continuous dataset that rewards anyone willing to pay attention to the details.